

With the exponential growth of data, the use of paper records, files, and storage discs has now become obsolete.
People have now started storing data in some database systems, but even with the evolution of the internet, new apps & technologies, the storage limit is insufficient.
Big Data is not just about data that is big or has a large volume. Big Data is one such form of data that arises from various sources and consists of various types of data in different formats. Here, we shall discuss the 7 Vs of Big Data.
According to Gartner, here’s the definition of Big Data
“Big data” is high-volume, velocity, and variety information asset that demands cost-effective and innovative forms of information processing for enhanced insight and decision making.”
Big Data is of three types:
- Structured Data – We can easily process, store, and retrieve data in a fixed format, i.e., we can say that when we store and extract, it should be in a proper manner/layout.
- Unstructured Data – This type of data lacks any structure and people can store it as it is. Analyzing such data is very time-consuming as well as challenging.
- Semi-structured Data – This type of data is a mix of the above two types of big data i.e., structured and unstructured data. We also know it as hybrid big data.
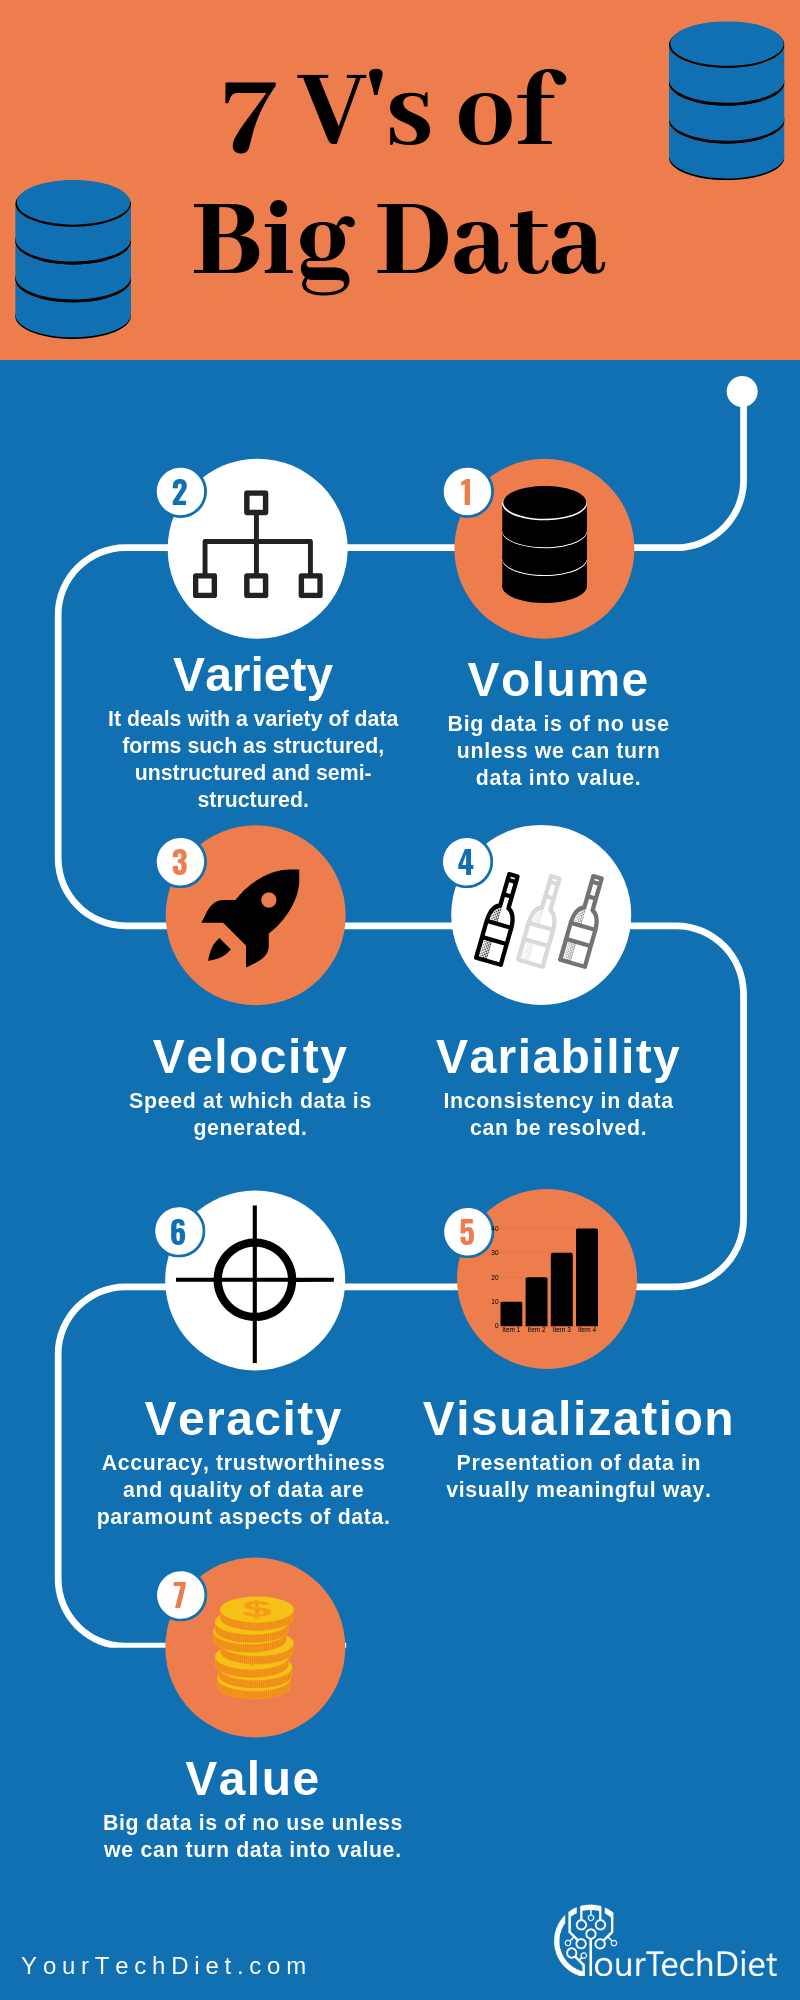
7 Vs of Big Data
This is the main characteristic of big data. The term volume here defines big data as “BIG”.
With a massive amount of data generated daily, we know gigabytes are not enough to store such a huge amount of data.
Because of this, now the data is stored in terms of Zettabytes, Exabytes, and Yottabytes. For instance, almost 50 hours of videos are uploaded on YouTube every single minute.
Now imagine how much data is being generated on YouTube itself.
Here variety means types of data sources. As discussed above, big data can be of various types – structured, semi-structured, and unstructured.
In today’s world, users generate large quantities of unstructured data, such as audio files, videos, images, text files, etc.
which are difficult to map due to their nature, i.e., they don’t have any set of rules, which makes them difficult to sort from essential data.
Velocity here refers to how fast the data can be processed and accessed. For example, social media posts, YouTube videos, audio files, and images that are uploaded in thousands every second should be accessible as early as possible.
4. Variability
Variability is different from the variety. This component refers to the data that keeps on changing constantly.
It mainly focuses on understanding and interpreting the correct meanings of raw data.
For example – A soda shop may offer 6 different blends of soda, but if you get the same blend of soda every day and it tastes different every day, that is variability.
The same is true in the case of data, and if it is continuously changing, then it can have an impact on the quality of your data.
If your data is not accurate, it is of no use, and here comes the concept of Veracity. It is all about making sure the data you gather is accurate and also keeping the bad data away from your systems.
It is also the trustworthiness or quality of data that a company receives and processes to derive useful insights.
Visualization here refers to how you can present your data to the management for decision-making purposes.
We all know that data is presentable in many ways, such as Excel files, word docs, graphical charts, etc.
Irrespective of the format, the data should be easily readable, understandable, and accessible, and that’s why data visualization is important.
Value is known as the end game in big data. Every user needs to understand that the organization needs some value after efforts are made and resources are spent on the above-mentioned V’s.
Big Data can help a user provide value if they integrate and process it correctly.
7 V’s of Big Data Infographic
So what do you think all the 7 Vs of big data tell us about it? Well, we can say that big data is massive and is expanding minute by minute.
On the other hand, big data is also changing at a faster rate with hundreds of data formats. To gain the best possible benefits of big data, companies need to understand each and every characteristic.
Recommended For You:
What is DevOps? The Roadmap for DevOps
How is DevOps useful for Big Data?